John Hyunjun Choi
June 2025 | Working Paper
Revisiting the VIX > 30 Strategy: Historical Limitations and Behavioral Context
Market timing and position sizing is one of the biggest challenges investors face during periods of market stress. Investors tend to initiate positions too early or allocate capital too aggressively, both of which can exacerbate drawdowns.
To address this challenge, we examine a commonly used approach: adding equity exposure when the CBOE Volatility Index (VIX) rises above 30. This level is often interpreted as a proxy for extreme investor fear and potential market capitulation. Using Python-based backtesting, we identified buy signals triggered under this condition and overlaid them on the performance of the S&P 500 Index from 2020 through 2025.
This strategy tends to work best when markets experience short-term turbulence within a bigger uptrend. Take March and April 2025, for example — trade tensions pushed the VIX above 30, and the S&P 500 dropped sharply from 5,800 to 4,900. But just as quickly, it bounced back — a move that fit the exact pattern we’ve seen in other successful trades using this approach. We saw something similar in July 2024, when a brief VIX spike past 30 was followed by another rebound in equity prices.
However, the results vary significantly under different macroeconomic and systemic conditions. The performance of the VIX > 30 rule during the COVID-19 crisis in March 2020 and the Russia-Ukraine conflict combined with Federal Reserve tightening in early 2022 reveals meaningful limitations.

Figure 1 – S&P 500 (blue line) and VIX time series (red line), highlighting entry points where the VIX exceeds 30(marked in green)
Case 1: March 2020 – COVID-19 Crisis
The VIX surged past 80 as global equity markets rapidly repriced systemic uncertainty. The S&P 500 declined by approximately 30% within one month. Although subsequent fiscal and monetary interventions (e.g., Fed rate cuts, quantitative easing, and the CARES Act) stabilized markets, the volatility regime persisted long enough to trigger numerous early buy signals—many of which underperformed in the short run absent a dollar-cost averaging (DCA) overlay.
Case 2: 2022 – Geopolitical and Monetary Policy Shock
In early 2022, the VIX fluctuated between 30 and 35 for several weeks. This led to signal clustering, with multiple buy triggers generated in close succession amid continued market deterioration. The strategy failed to differentiate between temporary panic and sustained structural drawdowns, resulting in suboptimal timing and significant exposure to downside risk.
These observations highlight a probelm in the VIX > 30 approach: its inability to discriminate between short-term volatility spikes and prolonged systemic risk. The signal becomes especially unreliable when volatility remains elevated across multiple sessions, causing a flood of entries during deteriorating market conditions.
Strategic Implication
While the VIX remains a valuable indicator of investor sentiment and perceived risk, relying solely on a static threshold (e.g., VIX > 30) introduces the risk of entering prematurely during falling markets. To mitigate this, we propose a refined framework centered on the concept of regime change — a behavioral and technical transition from peak fear toward stabilization.
Such a framework requires supplementary signals that can confirm when volatility has not only spiked, but also begun to subside, accompanied by indications of momentum reversal or macroeconomic support. In the subsequent section, we introduce the integration of the Relative Strength Index (RSI) as a complementary signal to VIX, forming the foundation of a more robust volatility regime classification system.
Constructing Volatility Regimes by Combining VIX and RSI Indicators
This study looks at how we can improve on the common approach of buying stocks when the VIX breaks above 30 — a level most people take as a sign of panic.
While VIX > 30 often lines up with short-term market bottoms, there’s a catch: in deeper or longer selloffs like we saw in 2022, it tends to give too many false signals. The result? Whipsaws and poor timing. During such periods, volatility remained elevated for an extended time, generating an excessive number of premature buy signals and yielding suboptimal returns.
To address this issue, we propose a regime-based framework that integrates an additional technical indicator—the Relative Strength Index (RSI)—to refine the entry criteria and mitigate false positives. Specifically, we define our core regime condition as follows:
- VIX > 30 to capture periods of elevated market uncertainty
- RSI < 40 to reflect deteriorating price momentum or oversold conditions
By jointly applying these filters, we aim to isolate market environments in which both investor fear and downward price pressure are present—conditions that often precede meaningful price reversals but also involve considerable short-term risk. We define this intersection (high VIX + low RSI) as a “panic zone” in our regime taxonomy.
The strategy is implemented using Python and backtested using daily data from 2020 to 2025. Our findings indicate that while a VIX-only strategy tends to produce frequent entries—especially during macro-driven volatility events—the combined VIX + RSI approach reduces noise and more effectively clusters signals around potential turning points.
Moreover, our preliminary results suggest that delaying entry until RSI begins to recover (i.e., transitioning from RSI < 40 to RSI ≥ 40) may further enhance timing by capturing not only extreme conditions, but also the onset of regime shifts toward market stabilization.
This dual-signal approach offers a stronger and more behaviorally grounded framework for volatility-based investing and may be particularly applicable to tactical asset allocation or risk overlay strategies.
In our model, the regime framework is constructed by combining two signals:
- VIX > 30: proxy for market fear or elevated volatility
- RSI < 40: proxy for weak momentum or oversold conditions
By combining these two binary signals, we define four distinct market regimes as follows.
Significance of Combined Conditions
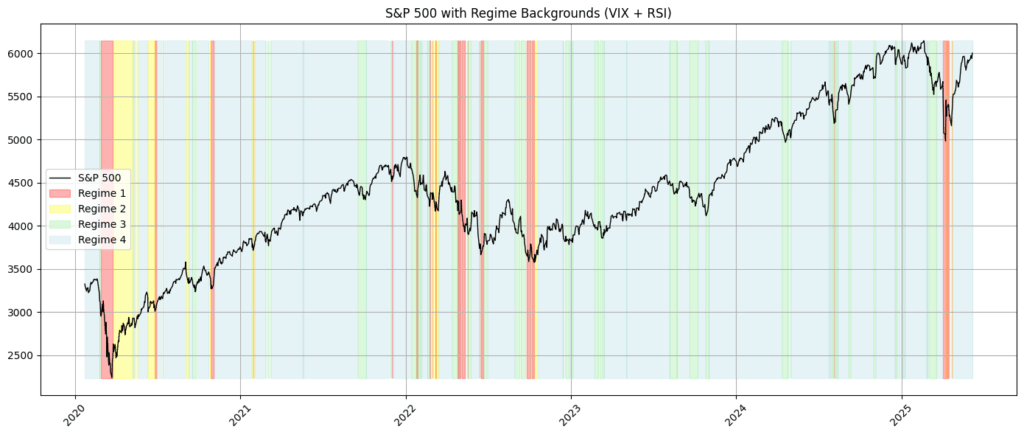
Figure 2 – Regime Classification Overlay on S&P 500 Price Chart Using VIX > 30 and RSI < 40 Thresholds
| Type of Regime | VIX > 30 | RSI < 40 | Interpretation |
| Regime 1 (Red) | Yes | Yes | Panic + Oversold (Capitulation) |
| Regime 2 (Yellow) | Yes | No | Panic, but Momentum Stabilizing |
| Regime 3 (Green) | No | Yes | Calm Market, It often occurs when market bellwethers (e.g., NVDA, TSLA, AAPL) experience sharp sell-offs due to earning disappointments, sector-specific stress, etc. |
| Regime 4 (Blue) | No | No | Normal/Stable Regime |
- VIX > 30 Alone Is Rare
Instances where the VIX exceeds 30 are relatively uncommon and typically coincide with periods of acute market stress, such as systemic financial disruptions, geopolitical crises, or abrupt shifts in monetary policy. Under normal market conditions, the VIX generally remains within the 15–25 range. A reading above 30 is therefore interpreted as a marker of elevated investor fear and risk aversion. - RSI < 30 on the S&P 500 Is Also Rare
The Relative Strength Index (RSI) is a widely used technical indicator designed to measure short-term momentum. For a broad and diversified index such as the S&P 500, readings below 30—commonly viewed as signaling an “oversold” condition—are infrequent and typically arise only during periods of rapid, sharp market sell-offs or systemic shock events. - VIX > 30 and RSI < 30: A Combined Indicator of Market Capitulation
When both signals trigger at the same time — VIX above 30 and RSI below 30 — it’s more than just noise. It’s a sign of panic and forced selling. These moments often mark full-blown capitulation, when investors are rushing for the exits. From 2020 to 2025, only 13 daily observations in the dataset met both criteria simultaneously. These events align with the following market events:
- March 2020 – COVID-19 Crisis: During this period, the VIX surged above 80, while RSI on the S&P 500 fell significantly below 30 on multiple trading days. The market experienced extreme dislocation and rapid drawdowns.
- February–July 2022 – Federal Reserve Tightening and the Ukraine War: Elevated geopolitical tensions and aggressive monetary tightening contributed to a sustained drawdown in equity markets. Several signals were triggered during this prolonged period of stress.
- April 2025 – U.S. Trade Conflict Correction: A sharp but short-lived spike in both volatility and downward momentum produced a clear panic signal consistent with Regime 1 in early to mid-April
Forward Return by Regime (30 day / 60 day / 90 day / 120 day)
| Regime | Conditions | 30D Return | 60D Return | 90D Return | 120D Return |
|---|---|---|---|---|---|
| 1 | VIX > 30 and RSI < 40 | +5.2% | +6.8% | +9.4% | +9.1% |
| 2 | VIX > 30 and RSI ≥ 40 | +6.9% | +9.3% | +11.1% | +12.8% |
| 3 | VIX ≤ 30 and RSI < 40 | -2.5% | -1.3% | +0.4% | +1.1% |
| 4 | VIX ≤ 30 and RSI ≥ 40 | +0.9% | +2.2% | +3.6% | +5.4% |
Return Analysis by Regime
The return patterns across regimes offer meaningful insights into the effectiveness of each condition. Regime 2 (VIX > 30 and RSI ≥ 40) demonstrates the highest consistency and return over each forward investment horizon, suggesting that waiting for signs of momentum recovery amid persistent fear may be a superior timing strategy.
Regime 2 (VIX > 30 and RSI ≥ 40) delivers the most consistent returns across multiple time horizons, suggesting that waiting for signs of momentum recovery amid persistent fear may be a good timing strategy.
Regime 1 (VIX > 30 and RSI < 40) shows strong initial gains, but these gains often tend to reverse, possibly reflecting the heightened uncertainty and ongoing liquidation pressure. This regime may capture panic bottoms but is more prone to volatility.
Regime 3 (VIX ≤ 30 and RSI < 40) appears to be the weakest, exhibiting negative or near-zero returns even after 120 days. This pattern is consistent with environments where individual stock sell-offs are not accompanied by broad market fear—frequently driven by idiosyncratic issues.
Regime 4 (VIX ≤ 30 and RSI ≥ 40) is associated with modest, steady gains. It may be more representative of trend-following or passive investing environments, rather than tactical opportunity zones.
Overall, the data suggest that the combined regime framework not only improves signal clarity but also aligns well with investor behavior during different phases of the market cycle.
Regime Transitions and the Need for Structural Confirmation
In several observations, the market shift from Regime 1 (VIX > 30 and RSI < 40) to Regime 2 (VIX > 30 and RSI ≥ 40). This pattern can suggest early signs of price stabilization, although volatility still remains elevated. This transition often coincides with short-term rebounds, but it doesn’t reliably mark a lasting turning point.
For example, in May 2021, the market briefly entered Regime 2 following a transition from Regime 1, leading to a a brief rally. However, this was followed by a breakdown below the previous support level, a clear sign of a failed recovery and renewed downward pressure. This case shows that regime transitions alone do not offer reliability as entry signals, particularly in bear market environments prone to false recoveries or technical bounces.
Proposed Enhancement: Regime Signal with Structural Confirmation
To improve the practical applicability of the proposed regime-based strategy, we recommend incorporating technical structure confirmation into the entry rule. The enhanced approach involves the following criteria:
- Observe a transition from Regime 1 to Regime 2, indicating that momentum is stabilizing while volatility remains elevated.
- Confirm that price remains above the prior swing low, which serves as a support structure and increases the likelihood that the regime shift is sustainable.
- Optionally integrate volume confirmation or macro-level catalysts, such as dovish central bank signals or fiscal interventions, to strengthen signal confidence.
This combined framework merges quantitative regime classification with price action validation, enhancing the reliability of signals and improving alignment with actual market turning points. By filtering regime transitions through a structural lens, the strategy seeks to reduce the risk of premature entries and better capture durable recoveries.
References
- Yahoo Finance. (2025). Historical daily closing prices for S&P 500 Index (^GSPC) and CBOE Volatility Index (^VIX), 2020–2025 [Data set]. Retrieved via yfinance Python API from https://finance.yahoo.com/
- Federal Reserve Board. (2020, March 15). Federal Reserve issues FOMC statement. https://www.federalreserve.gov/newsevents/pressreleases/monetary20200315a.htm
- U.S. Congress. (2020, March 27). H.R.748 – Coronavirus Aid, Relief, and Economic Security Act. https://www.congress.gov/bill/116th-congress/house-bill/748
- Whaley, R. E. (2000). The investor fear gauge. Journal of Portfolio Management, 26(3), 12–17. https://doi.org/10.3905/jpm.2000.319723
- Lo, A. W., & MacKinlay, A. C. (1999). A Non-Random Walk Down Wall Street. Princeton University Press.
- Andersen, T. G., Bollerslev, T., Diebold, F. X., & Vega, C. (2007). Real-time price discovery in global stock, bond and foreign exchange markets. Journal of International Economics, 73(2), 251–277. https://doi.org/10.1016/j.jinteco.2007.02.004
- Ang, A., & Timmermann, A. (2012). Regime Changes and Financial Markets. Annual Review of Financial Economics, 4, 313–337. https://doi.org/10.1146/annurev-financial-110311-101808
- Connolly, R. A., Stivers, C., & Sun, L. (2005). Stock market uncertainty and the stock-bond return relation. Journal of Financial and Quantitative Analysis, 40(1), 161–194. https://doi.org/10.1017/S0022109000001779
- Kaminski, K. (2011). Managed Futures and Volatility: Decoupling a “Convex” Relationship with Volatility Cycles. CME Group whitepapers, 1-2 https://www.cmegroup.com/education/files/managed-futures-and-volatility.pdf?utm_source=chatgpt.com
- Wang, J. (2022). Chapter 8 Crisis Monetary Policy, Democratizing the Fed,Central Banking 101. 183-186
답글 남기기